Overview
The InclusiveVidPose dataset contains a diverse collection of video sequences featuring individuals with various types of limb deficiencies. Below are the key statistics of our dataset.
313
Videos
401
Unique Individuals
345,000+
Frames Annotated
346,000+
Poses Annotated
Demographic Distribution
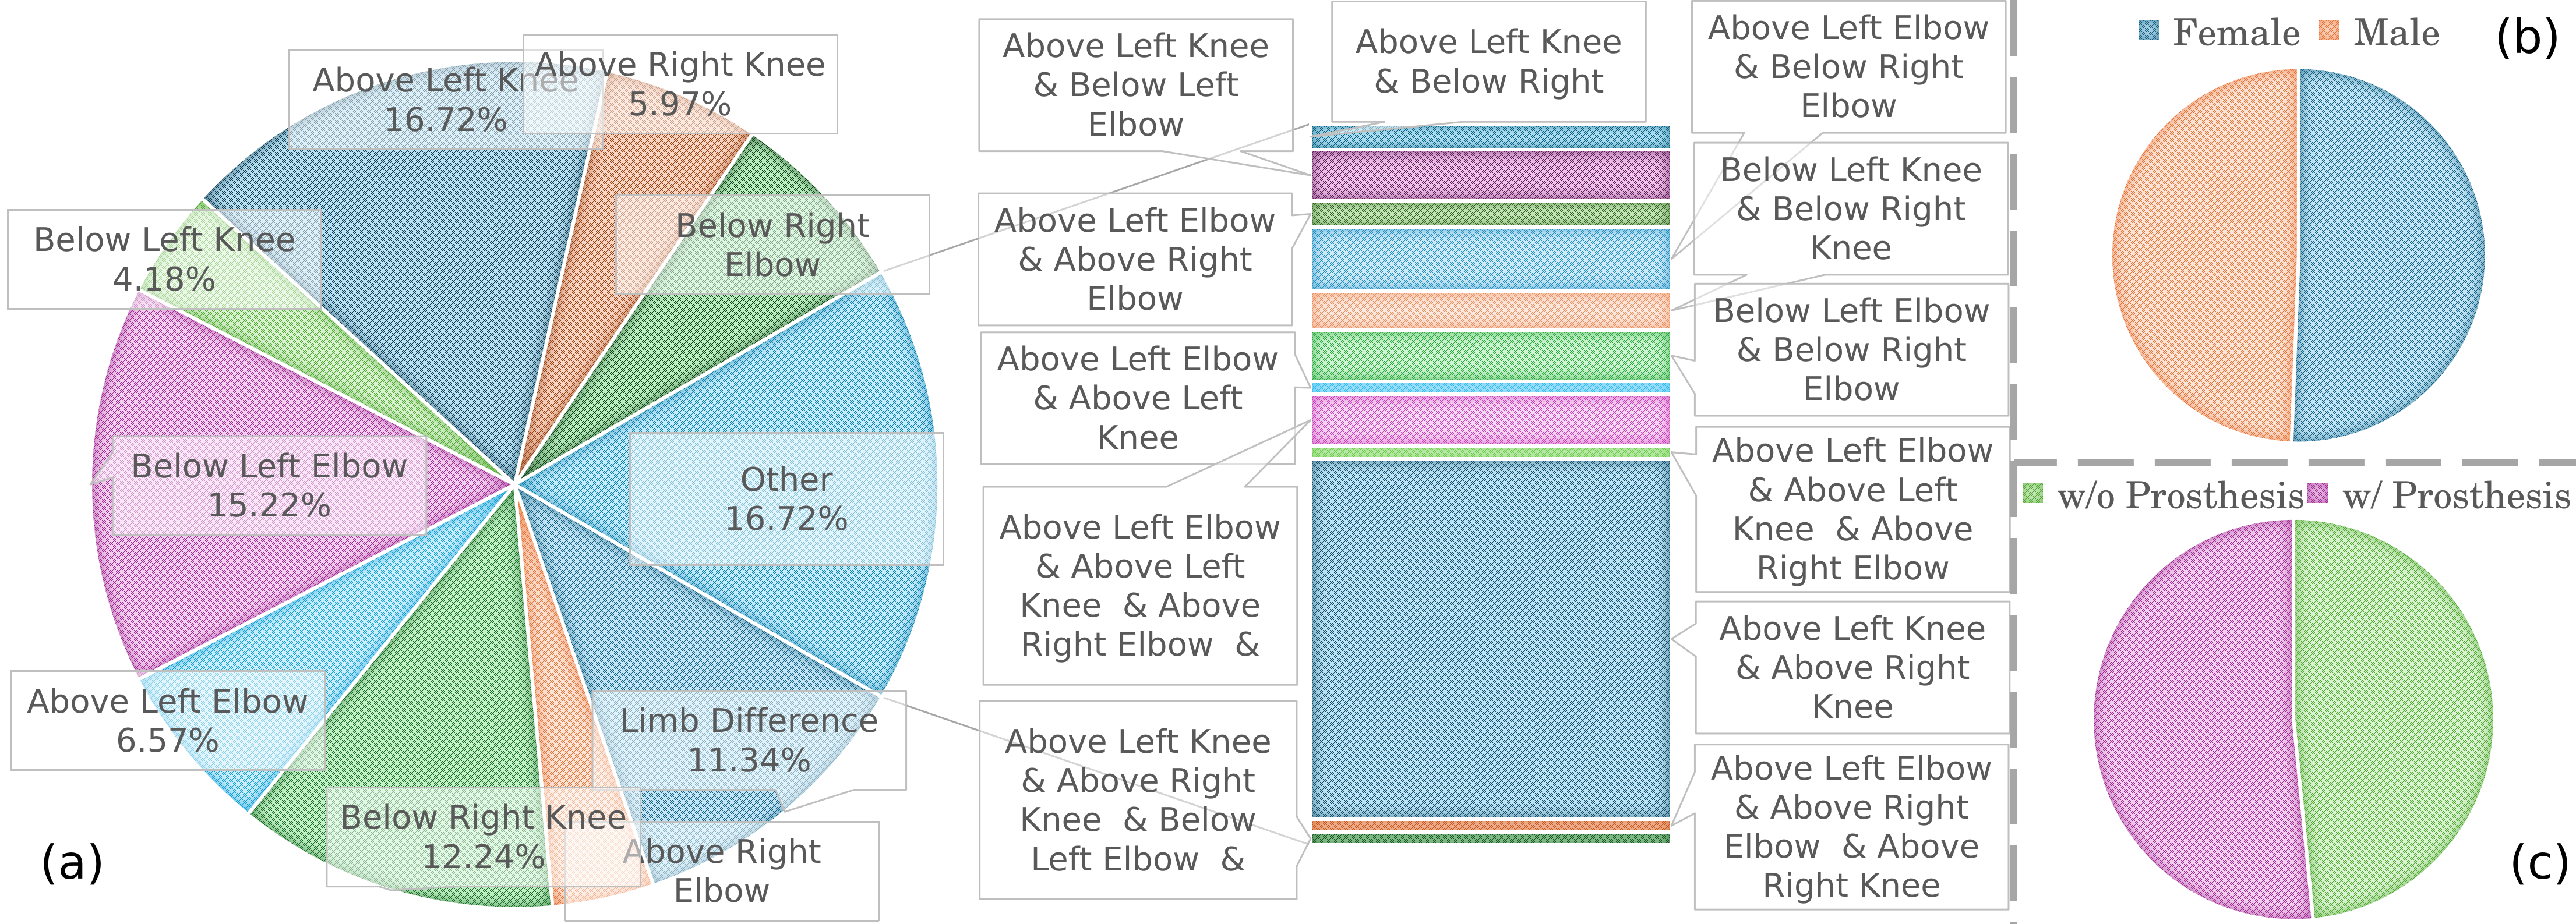
Figure 1: Overview of Participant Distribution by Deficiency Type, Gender, and Prosthesis. (a) Distribution of limb-deficiency types, with single-site deficiencies and multi-site cases. (b) Gender Distribution. (c) Distribution of individuals with and without prosthetic limbs.
Limb Deficiency Types
| Type | Count | Percentage |
|---|---|---|
| Upper Limb Amputation | 125 | 40% |
| Lower Limb Amputation | 94 | 30% |
| Congenital Limb Difference | 63 | 20% |
| Multiple Limb Differences | 31 | 10% |
Activity Distribution

Figure 2: Distribution of different activities in the dataset
Dataset Splits
| Split | Videos | Frames |
|---|---|---|
| Training | 219 | 17,500 |
| Validation | 47 | 3,750 |
| Testing | 47 | 3,750 |
Annotation Statistics
- Average number of keypoints per frame: 33
- Total annotated instances: 825,000+
- Average annotation time per video: 2.5 hours
- Inter-annotator agreement: 92.3%